Direct emissions — scope 1
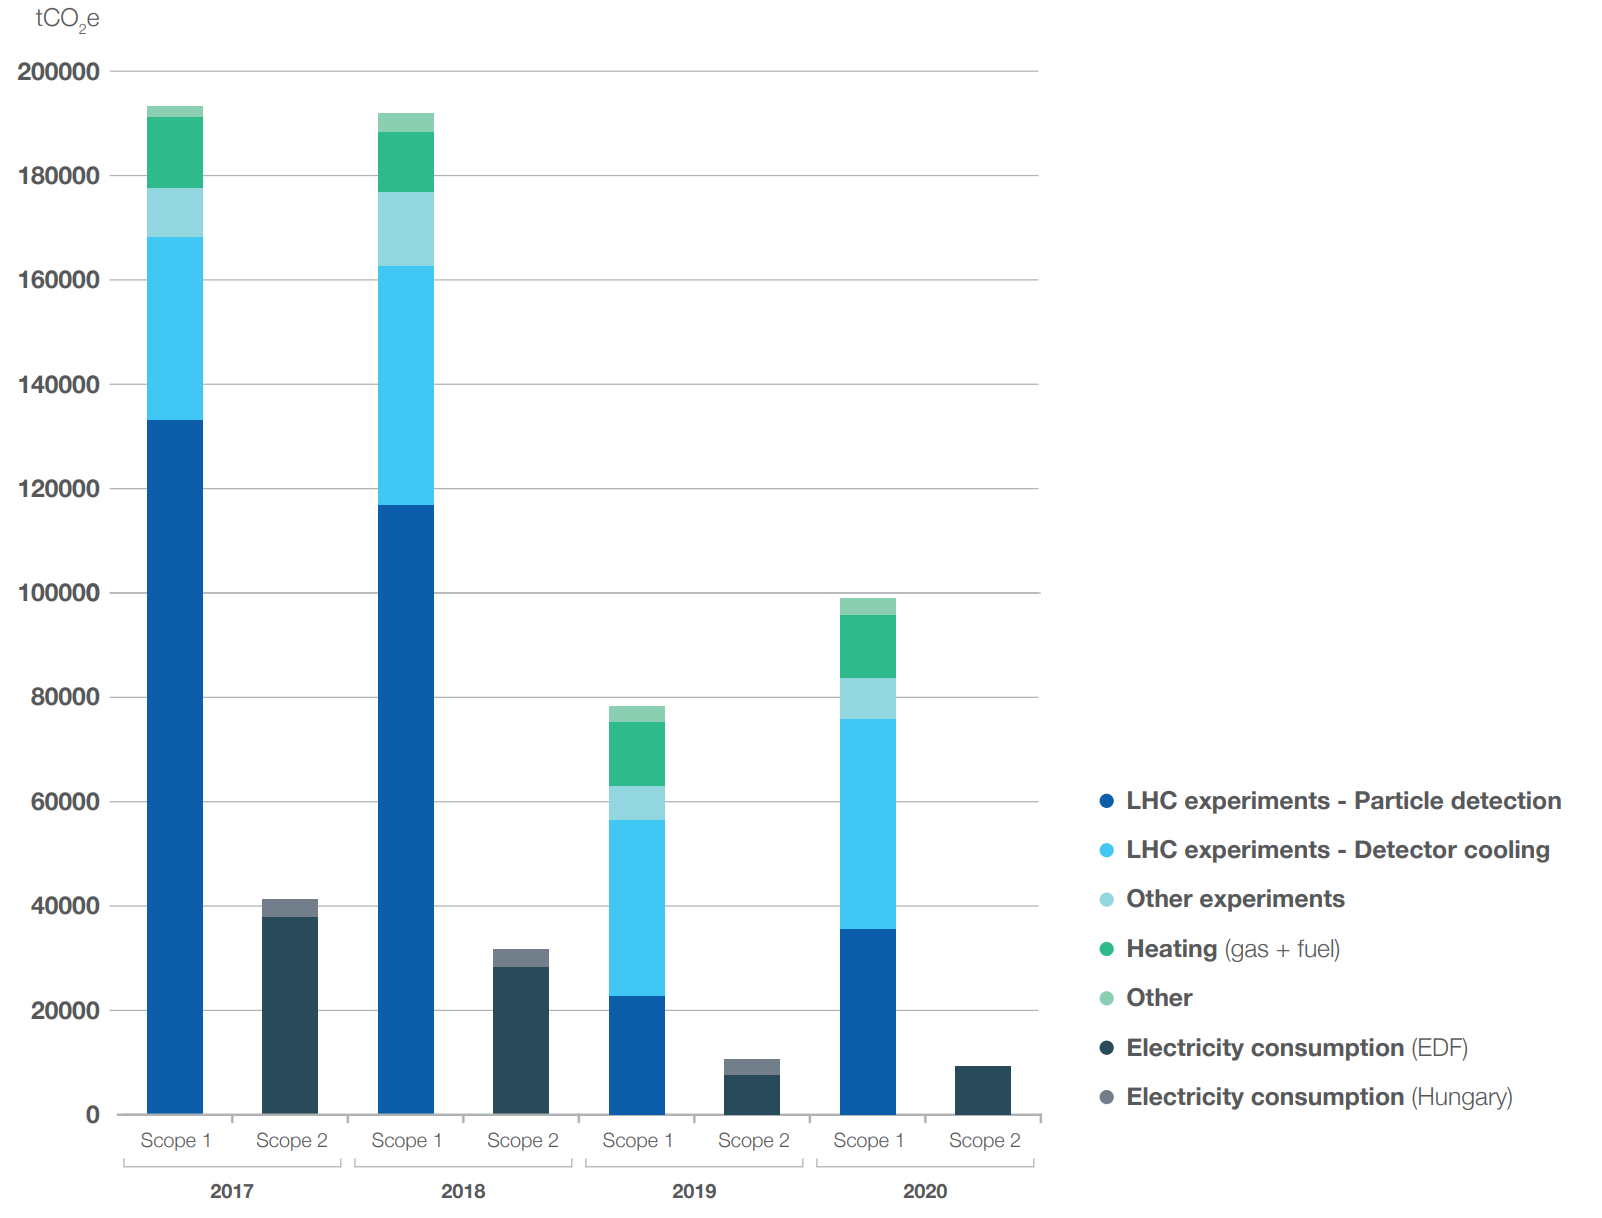
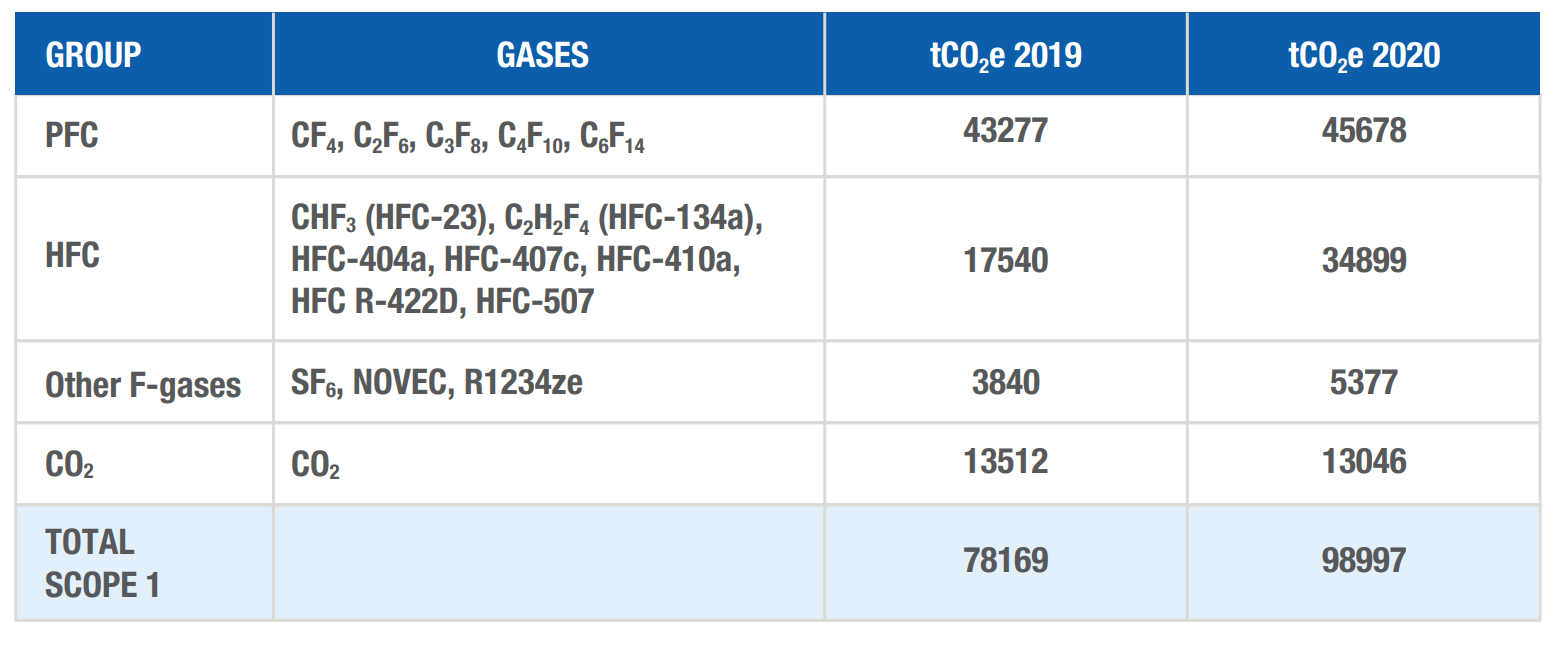
CERN’s direct greenhouse gas emissions (scope 1) are mostly related to the use of various fluorinated gases (F-gases) for particle detection and detector cooling in the large LHC experiments. This includes SF6, HFCs and PFCs for particle detection, HFCs and PFCs for detector cooling and HFCs for air conditioning systems. SF6 is also used for electrical insulation in power supply systems. In 2019 and 2020, the total amount of scope 1 greenhouse gas emissions was 78 169 and 98 997 tonnes of CO2 equivalent (tCO2e) respectively. This is less than half of the amount emitted over the period 2017-2018, since CERN’s accelerator complex was in its second long shutdown (LS2). However, it is not zero due the fact that detector cooling is maintained during long shutdowns to avoid accelerated ageing of the particle detection systems.
Optimisation strategies
CERN’s greenhouse gas mitigation efforts focus on reducing F-gas emissions, since this is the main contributor. The Organization’s objective is to reduce its scope 1 emissions by 28% by the end of 2024 (baseline year: 2018). To optimise the use of gases in the detectors, CERN has developed an R&D strategy based on four pillars: gas recuperation, abatement, optimisation of current technologies, and replacing gases with more environmentally friendly ones.
During Run 2 of the LHC, CERN tested a prototype for an HFC-134a recuperation plant on a real detector. The results from the prototype so far show a recuperation efficiency of close to 85%. An updated prototype is being designed and is planned to be installed in two detectors in 2022.
The detectors installed in the LHC experiments are equipped with F-gas recirculation systems to reduce the consumption of gas. They have an average recirculation efficiency of 90%, due to gas purity requirements. The main contributors to CERN’s F-gas emissions are small leaks in the detectors as a result of their necessarily light construction. During LS2, the experiments launched a leak repair campaign. Not all planned repairs could be executed because of the COVID-19 pandemic, but the campaign remains a priority.
LS2 also marked the first steps towards replacing F-gases with CO2 in detector cooling systems. CO2 has a substantially lower global warming potential than F-gases, and it is also efficient in very small pipes, which are essential to some detector systems in the LHC.
In 2020, CERN launched a working group on managing F-gases, with representatives from the departments concerned and the large LHC experiments. The group looked at issues such as the implementation of a centralised F-gas procurement policy, leak detection, replacement alternatives, training courses for personnel handling F-gases, and improving traceability and reporting.
Other indirect emissions — scope 3
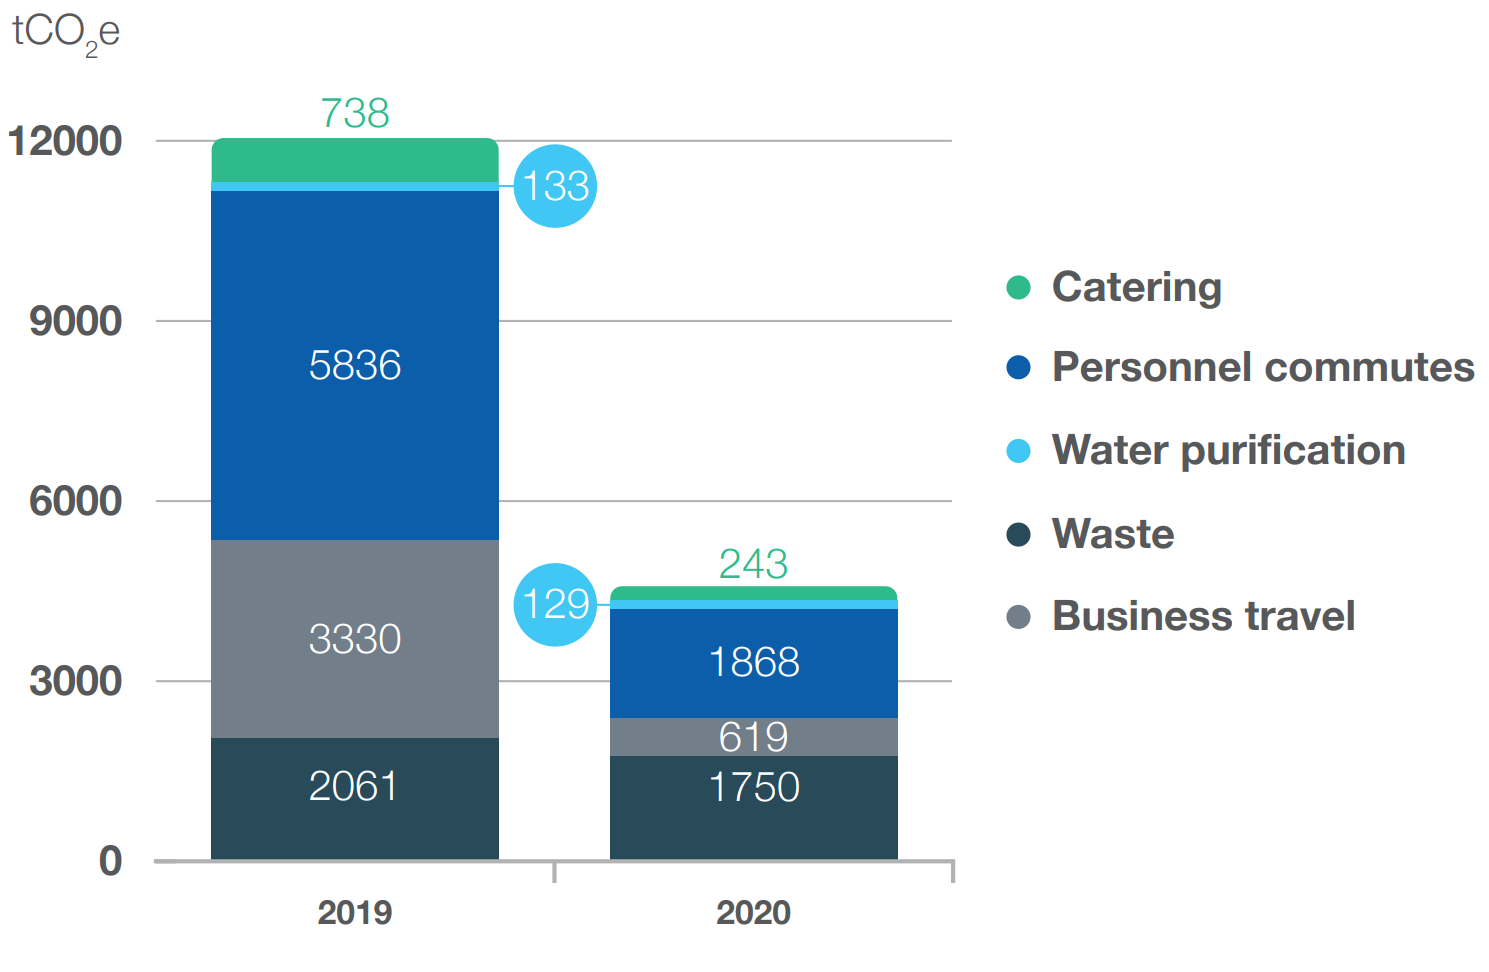
"Waste" includes the waste sent through different elimination pathways as well as water sent to wastewater treatment plants. For business travel and personnel commutes, only personnel on CERN’s payroll are included and the 2020 value for personnel commutes is a rough estimate. Emissions arising from procurement are not included.
In 2020, CERN initiated an evaluation of its scope 3 emissions for the first time. The estimate presented here covers the years 2019 and 2020. The Organization assessed emissions from business travel, personnel commutes, catering, waste treatment and water purification, applying a process-based approach. CERN applied the Ecoinvent emission factors and used the 2013 global-warming- potential values of the Intergovernmental Panel on Climate Change (IPCC).
CERN’s procurement is expected to constitute the largest part of the Organization’s scope 3 emissions. It is also the hardest to quantify because of the diversity of products, suppliers and origins of purchases arising from the nature of CERN’s work and a procurement policy that strives to balance return to all of CERN’s Member and Associate Member States. A procedure for evaluating scope 3 emissions due to procurement, along with a project to assess how to green CERN's procurement, are in preparation. These will be covered in a future report.
Waste treatment and water purification
The scope 3 emissions related to water purification amounted to 133 and 129 tCO2e in 2019 and 2020 respectively. The indirect emissions arising from waste treatment are linked to the elimination pathways, and in 2019 and 2020 came to 2061 tCO2e and 1750 tCO2e respectively. A reduction in these emissions is attributable to water management and waste management.
Business travel
Emissions arising from business travel amounted to 3330 tCO2e and 619 tCO2e in 2019 and 2020 respectively. Most of the emissions result from air travel, mainly from long- distance flights.
In this report, only travel made by CERN’s employees and associated members of the personnel on CERN’s payroll was considered, as travel by CERN users was beyond the topic boundaries (see Management approach). Furthermore, user travel is usually paid for and managed by the users’ host institutions, and CERN has only limited control and oversight in the matter. Due to the large size of CERN’s user community, it is likely that travel-related emissions for users are several times higher than those for personnel on CERN’s payroll.
In 2020, CERN introduced an updated procedure for business travel that favours environmentally friendly travel modes in an effort to minimise the impact of professional travel.
Personnel commutes
Emissions related to personnel commutes came to 5836 tCO2e and 1868 tCO2e in 2019 and 2020 respectively. In 2020, commutes could not be accurately measured as CERN adapted to the pandemic, and the figure is based on a rough estimate derived from the number of meals served in CERN’s restaurants. As with business travel, emissions resulting from commuting were calculated for personnel on CERN’s payroll (about 4000 people). In addition, about 12,000 users regularly visit CERN for variable periods of time (this number fell considerably during the pandemic).Their emissions are not included in the calculations.
Around 77% of all CERN personnel commute to work from France, most using individual motorised vehicles due in part to a lack of public transport. CERN’s goal for 2025 is to keep individual motorised vehicle commuting constant, despite a growing scientific community. Overall, walking and cycling constitute 17% of all commutes.
CERN has a fleet of 750 bicycles available free of charge to its personnel, making it the largest such fleet among companies and organisations in Switzerland. The Laboratory also has a rental car fleet and a shuttle service for inter- and intra-site mobility. In 2020, CERN approved several measures to promote the environment-friendly mobility of its members, such as increasing the frequency of the shuttles and improving bicycle routes.
Catering
CERN has several restaurants, cafeterias and vending machines on its sites, all run by external companies. The main provider is NOVAE, which operates three restaurants, seven cafeterias and the majority of the vending machines present on site. On average, NOVAE provides around 3500 meals per day. The emissions related to food and beverages are derived from the food products purchased by NOVAE before preparation and serving, while the energy used in the kitchens on site for refrigeration and food preparation is included in CERN’s scope 2 data. CERN’s catering-related emissions were 738 tCO2e and 243 tCO2e in 2019 and 2020 respectively. Red meat and dairy products account for more than half of these emissions.
NOVAE has been actively working to reduce its environmental footprint over the years. Around 70% of the fresh produce purchased by NOVAE comes from less than 200 kilometres away. A phase-out of single-use plastics in the restaurants is ongoing but has been slowed down due to the COVID-19 pandemic.