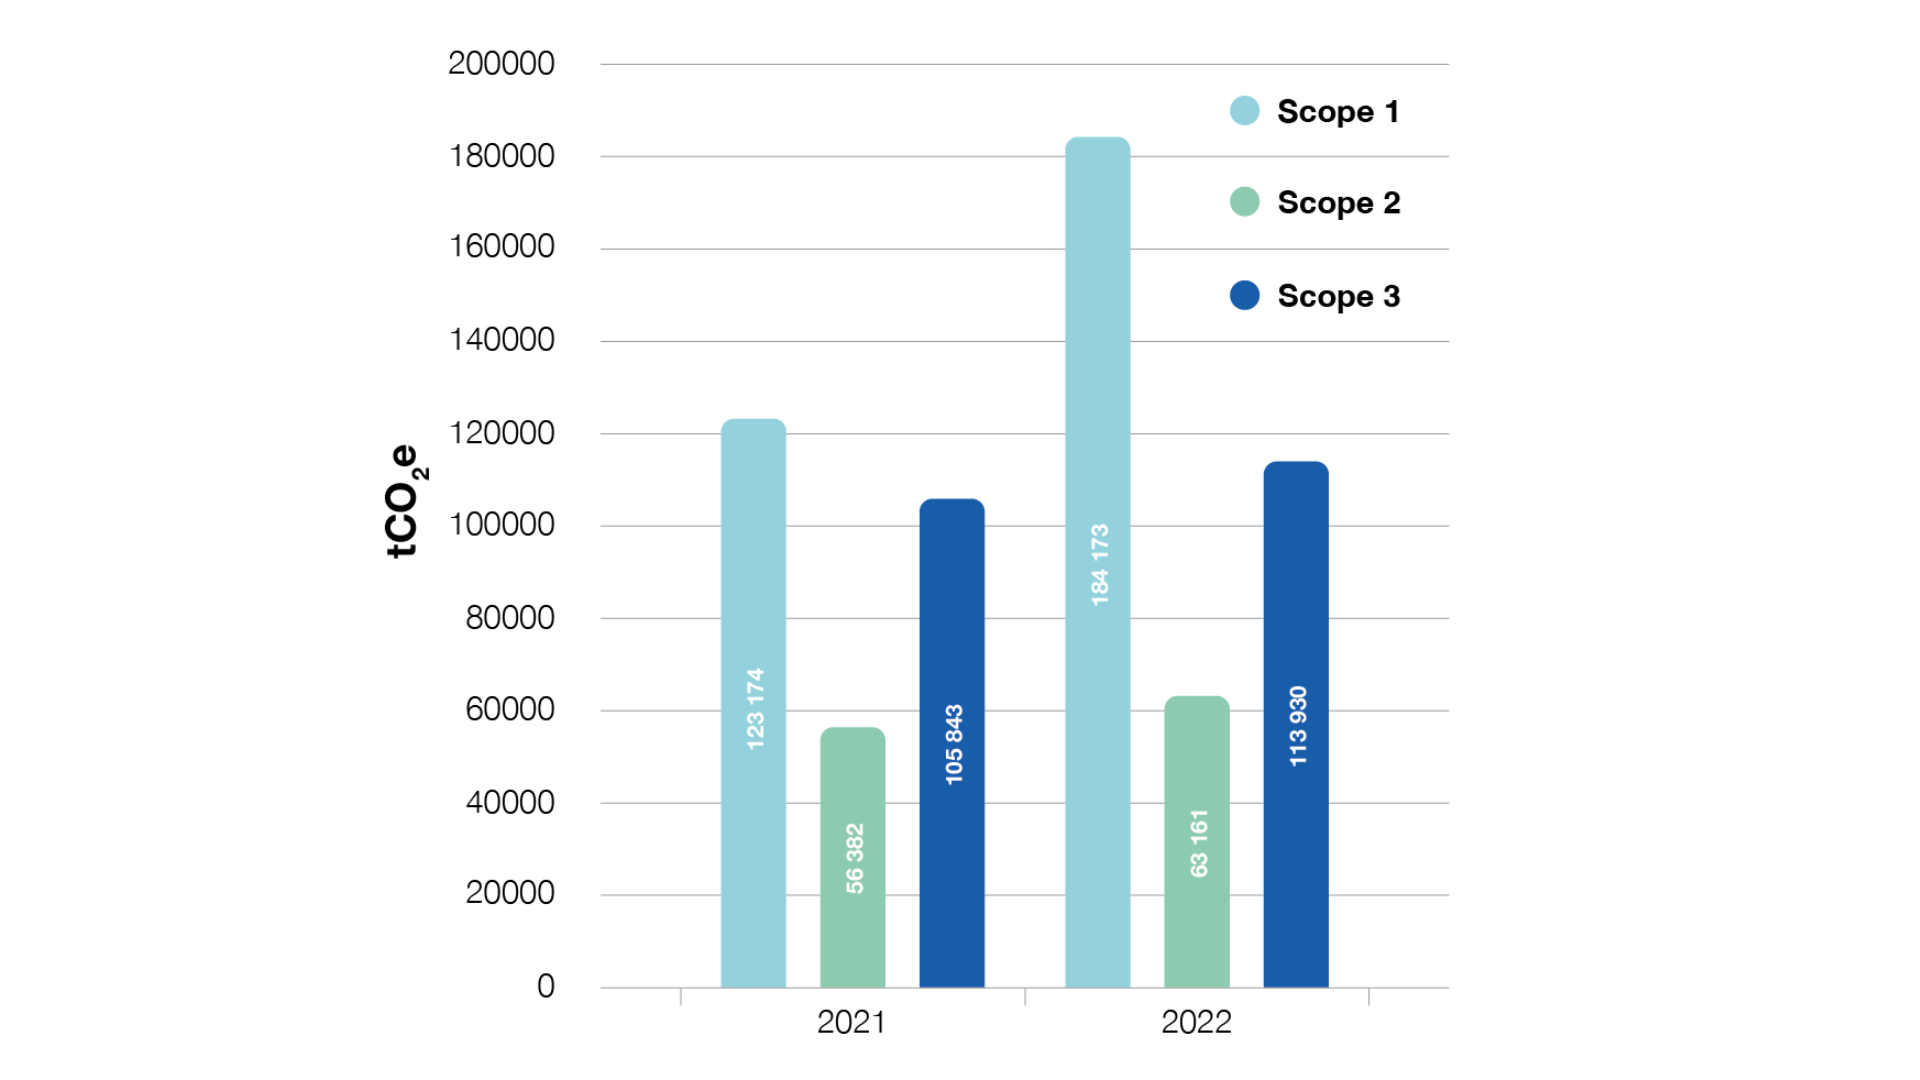
CERN reports on all emissions over which it has operational control. CERN’s greenhouse gas emissions are estimated in accordance with the internationally recognised methodology of the Greenhouse Gas Protocol, which categorises such emissions into three “scopes”. Scope 1 refers to the direct emissions resulting from an organisation’s facilities and vehicles, while scope 2 refers to indirect emissions related to the generation of electricity, steam, heating or cooling purchased for an organisation’s own use. Scope 3 refers to all other indirect emissions occurring upstream and downstream of an organisation’s activities, such as business travel, personnel commutes, catering and procurement.
DIRECT EMISSIONS – SCOPE 1
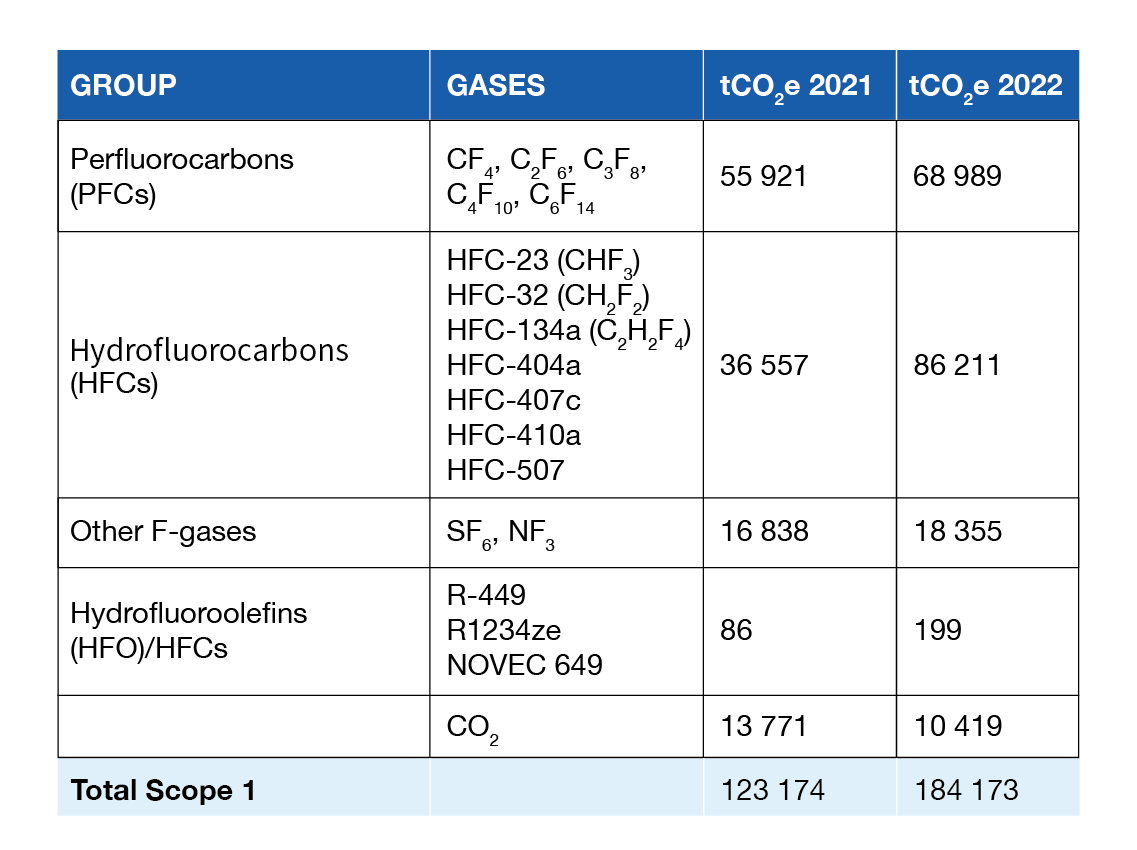
CERN’s direct greenhouse gas emissions (scope 1) arise from the Laboratory’s industrial infrastructure and on-site activities. Approximately 90% of CERN’s scope 1 emissions come from its experiments. These use a wide range of gas mixtures for particle detection and detector cooling, including fluorinated gases (F-gases) which have a high global warming potential (GWP) and therefore account for about 78% of the Organization’s direct emissions. The large experiments represent the main focus of CERN’s efforts to mitigate its greenhouse gas emissions. The main gases used are HFCs, PFCs and SF6 for particle detection, PFCs and HFCs for detector cooling and HFOs/HFCs for standard air conditioning systems. SF6 is also used for electrical insulation in power supply systems.
With the gradual restart of the accelerator complex in 2021 ready for the launch of Run 3 of the LHC in mid-2022, the total amount of scope 1 greenhouse gas emissions was higher than in the period 2019–2020, when the accelerators were not running, namely 123 174 and 184 173 tonnes of CO2 equivalent (tCO2e) in 2021 and 2022 respectively. CERN continuously improves its management, traceability and monitoring of F-gases, notably thanks to the awareness raised among stakeholders by the Working Group on F-Gases, which completed its work in 2021. In the reporting period, the large experiments have improved their approach and to minimise emissions, as reported below. Test facilities and other, smaller experiments have also improved their ability to trace emissions and are therefore now also included in the calculations for 2021 and 2022 to provide a complete view of scope 1 emissions.
A STRATEGY TO REDUCE SCOPE 1 EMISSIONS
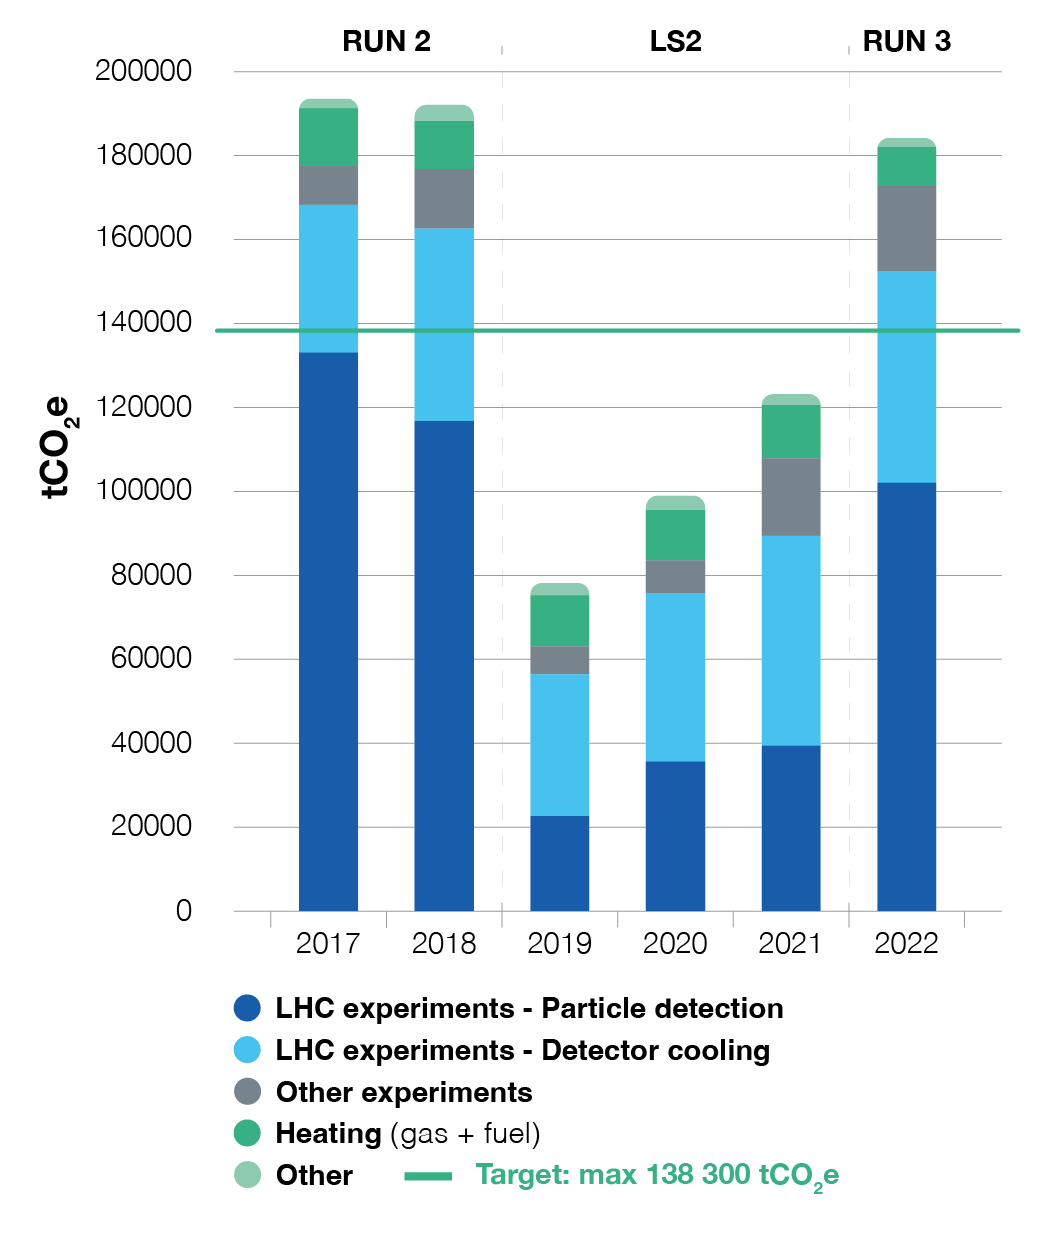
As for all other objectives that were set in the first environment report and whose original target date was 2024, the target has shifted concomitantly with the shift in the accelerator schedule. CERN’s objective is therefore to reduce its scope 1 emissions by 28% by the end of Run 3 (baseline: 2018). The current strategy to optimise the use of gases in the experiments rests on the following pillars: gas recirculation, gas recovery and the search for more environmentally friendly alternatives to the gases currently used. During Run 2 of the Large Hadron Collider (LHC), CERN tested a prototype plant for the recuperation of HFC-134a gas using a real detector. The results show a recovery efficiency of close to 80%. An updated prototype has been finalised and will be operational in the CMS experiment by March 2023.
A new CF4 recovery plant was designed, built and successfully implemented for the RICH2 detector in the LHCb experiment.
Intense R&D activity is under way to identify possible alternatives to the greenhouse gases currently used in particle detection. New gases with a lower GWP, as well as the partial replacement of HFC-134a with CO2, are currently being tested for the future.
The main contributors to CERN’s F-gas emissions are small leaks in the detectors caused by their light construction, which is dictated by the need to ensure that they fit inside the compact spaces that house them. As leaks occur regularly, systematic leak-repair campaigns are organised to ensure that they are contained and minimised. The leak-repair campaign launched by the ATLAS and CMS experiments during the second long shutdown (LS2) progressed well in the reporting period. It will continue in a later shutdown, when access will be possible again. Both experiments continued to invest in R&D to reduce detector leaks and prepare for a transition from PFCs to CO2 cooling.
INDIRECT EMISSIONS – SCOPE 2
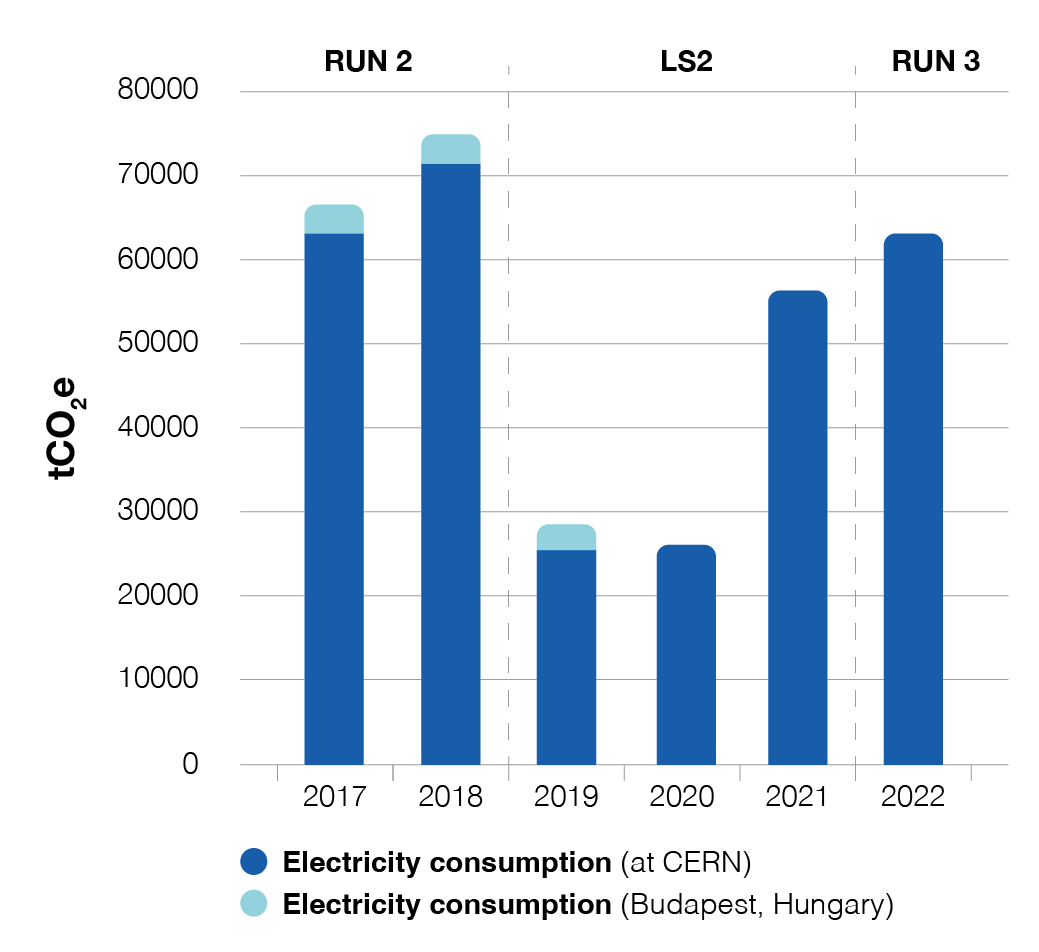
The total amount of scope 2 greenhouse gas emissions due to CERN's electricity consumption was 56 382 and 63 161 tCO2e in 2021 and 2022 respectively. EDF, CERN’s principal electricity supplier, generates low-carbon electricity, mainly of nuclear origin, which contributes to keeping energy-related emissions relatively low. In this report, CERN reviewed the CO2 emission factors that it applies in order to ensure that the figures quoted remain as accurate as possible. For CERN’s internal purposes, both the market-based and the location-based methodologies of the Greenhouse Gas (GHG) Protocol are followed. Market-based emission factors take into account the actual sources of purchased energy. The location-based methodology uses emission factors that provide an average of the emissions from all power sources within a specific geographic region over a given period of time. The results of the location-based methodology are provided in this report, with calculations based on average yearly emission factors taken from ADEME Base Empreinte©. All years in the period 2017–2022 have been recalculated, as shown in the graph.
OTHER INDIRECT EMISSIONS – SCOPE 3
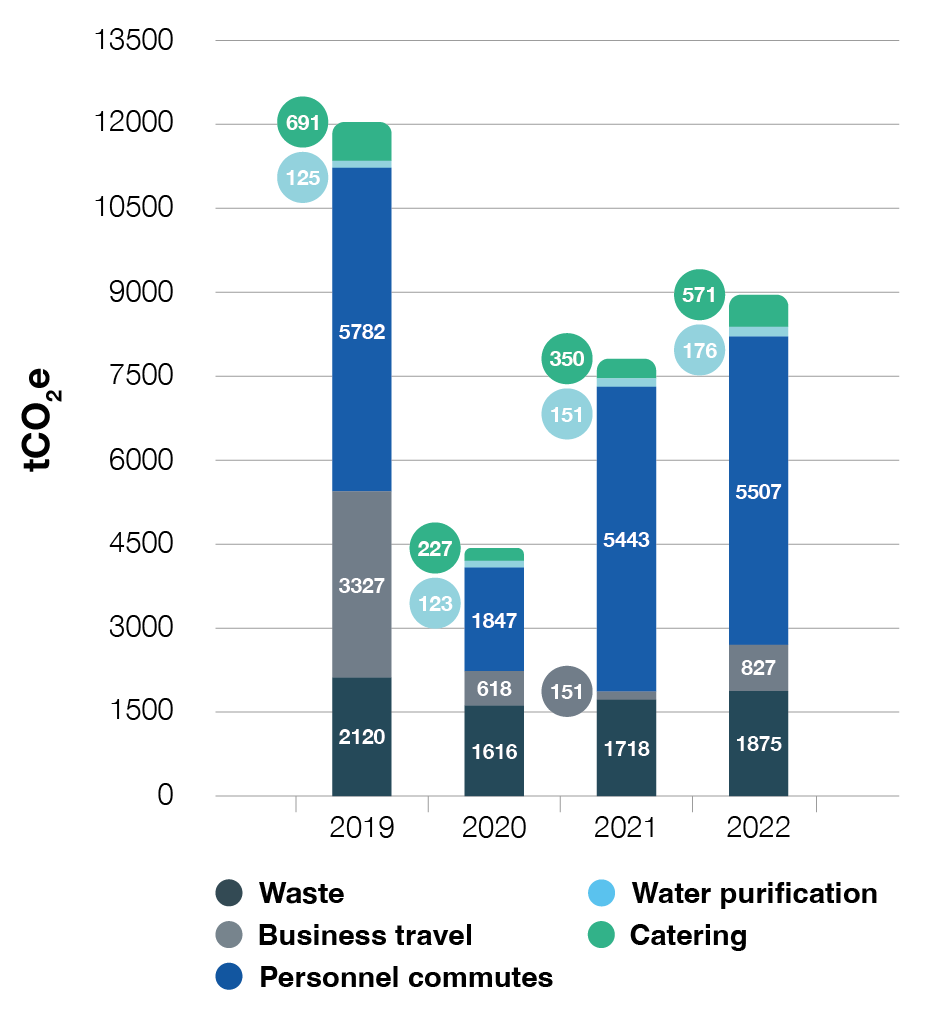
Emissions from business travel, personnel commutes, catering, waste treatment and water purification were assessed using an operational control approach. CERN applied the Ecoinvent emission factors to activity-based data and used the 2021 GWP values of the Intergovernmental Panel on Climate Change (IPCC), which include all gases from the report “AR6 Climate Change 2021: The Physical Science Basis”. The data from 2019 and 2020 have been recalculated using the same methodology and updated emission factors, which has resulted in changes to the previously reported data. As required by the GRI standards and the Greenhouse Gas Protocol, biogenic emissions have been calculated using the IPCC 2021 methodology and are also reported in this chapter alongside fossil emissions. This is to account for the emissions from the biodegradation or combustion of biomass. CERN does not participate in any offset scheme.
Total scope 3 emissions (excluding procurement, which is reported separately) amounted to 7813 and 8956 tCO2e in 2021 and 2022 respectively (832 and 1209 tCO2e biogenic emissions). This represents less than 10% of all of the Organization’s scope 3 emissions.
WASTE TREATMENT AND WATER PURIFICATION
Waste includes the waste that is sent through the different elimination pathways, as well as the water that is sent to public wastewater treatment plants. Indirect emissions arising from waste treatment in 2021 and 2022 amounted to 1718 tCO2e and 1875 tCO2e respectively (636 and 980 tCO2e biogenic). Scope 3 emissions related to water purification amounted to 151 and 176 tCO2e in 2021 and 2022 respectively (137 and 146 tCO2e biogenic).
PERSONNEL COMMUTES
Commuting emissions amounted to 5443 tCO2e and 5507 tCO2e in 2021 and 2022 respectively (24 tCO2e biogenic emissions for both years). As with business travel, emissions resulting from commuting were calculated for employed and associated members of personnel on CERN’s payroll. In addition, some 11 000 users regularly visit CERN for variable periods of time. Their emissions are not included in the calculations.
CERN’s goal for 2025 is to keep individual motorised vehicle commuting constant, despite a growing scientific community, and to encourage alternative modes of transportation, such as public transport, cycling and car pooling. CERN carried out a new survey of the mobility habits of its personnel at the end of 2022. This showed that 61% of CERN personnel use individual motorised vehicles for their commuting, a reduction of 7% compared to the last survey in 2018. For the 70% of CERN personnel who commute to work from France, this is due in part to a lack of adequate public transport. Overall, the fraction of those walking and cycling has increased and now constitutes 24% of all commutes (17% in 2018). The results of this survey will serve to guide further internal and external actions and objectives and to update the mobility plan that was first published in 2019.

CERN has a fleet of approximately 550 bicycles that are available free of charge to its personnel, making it the largest such fleet among companies and organisations in Switzerland. The Laboratory also operates a rental car fleet and a shuttle service for inter- and intra-site mobility. A dedicated mobility working group meets regularly to review all aspects of mobility services and processes, including safety, parking, green mobility, public transport and site access. Its activity is aligned with the general objectives that have been set for mobility in CERN’s 2040 Masterplan and in the mobility plan.
In this reporting period, CERN implemented various measures to promote the environmentally friendly mobility of its personnel, such as pilot schemes for e-bikes and e-scooters. Following the success of these pilots, the schemes have been adopted CERN-wide. The general approach is to decrease rather than increase the number of parking spaces. For example, the Science Gateway is being built on what was previously a car park, and as a result the number of parking spaces in the vicinity will be reduced from 400 to 240. The internal shuttle routes are being optimised, and electric car charging stations are being installed. Plans are underway to optimise the CERN car fleet, currently composed of some 700 vehicles, to progressively introduce electric vehicles. Furthermore, CERN is in constant dialogue with the local authorities to promote the use of public transport. This led, for example, to the construction in 2022 of two new bus stops at the entrance of the Prévessin site, which are due to be commissioned at the start of 2023.
SCOPE 3 EMISSIONS ARISING FROM PROCUREMENT
Scope 3 emissions for procurement are presented for the first time in this report. In 2021 and 2022 respectively, CERN spent around 471 MCHF and 462 MCHF on purchases, including goods, services and supplies. Emissions related to purchased goods and services and capital goods amounted to 98 030 tCO2e and 104 974 tCO2e in 2021 and 2022 respectively.
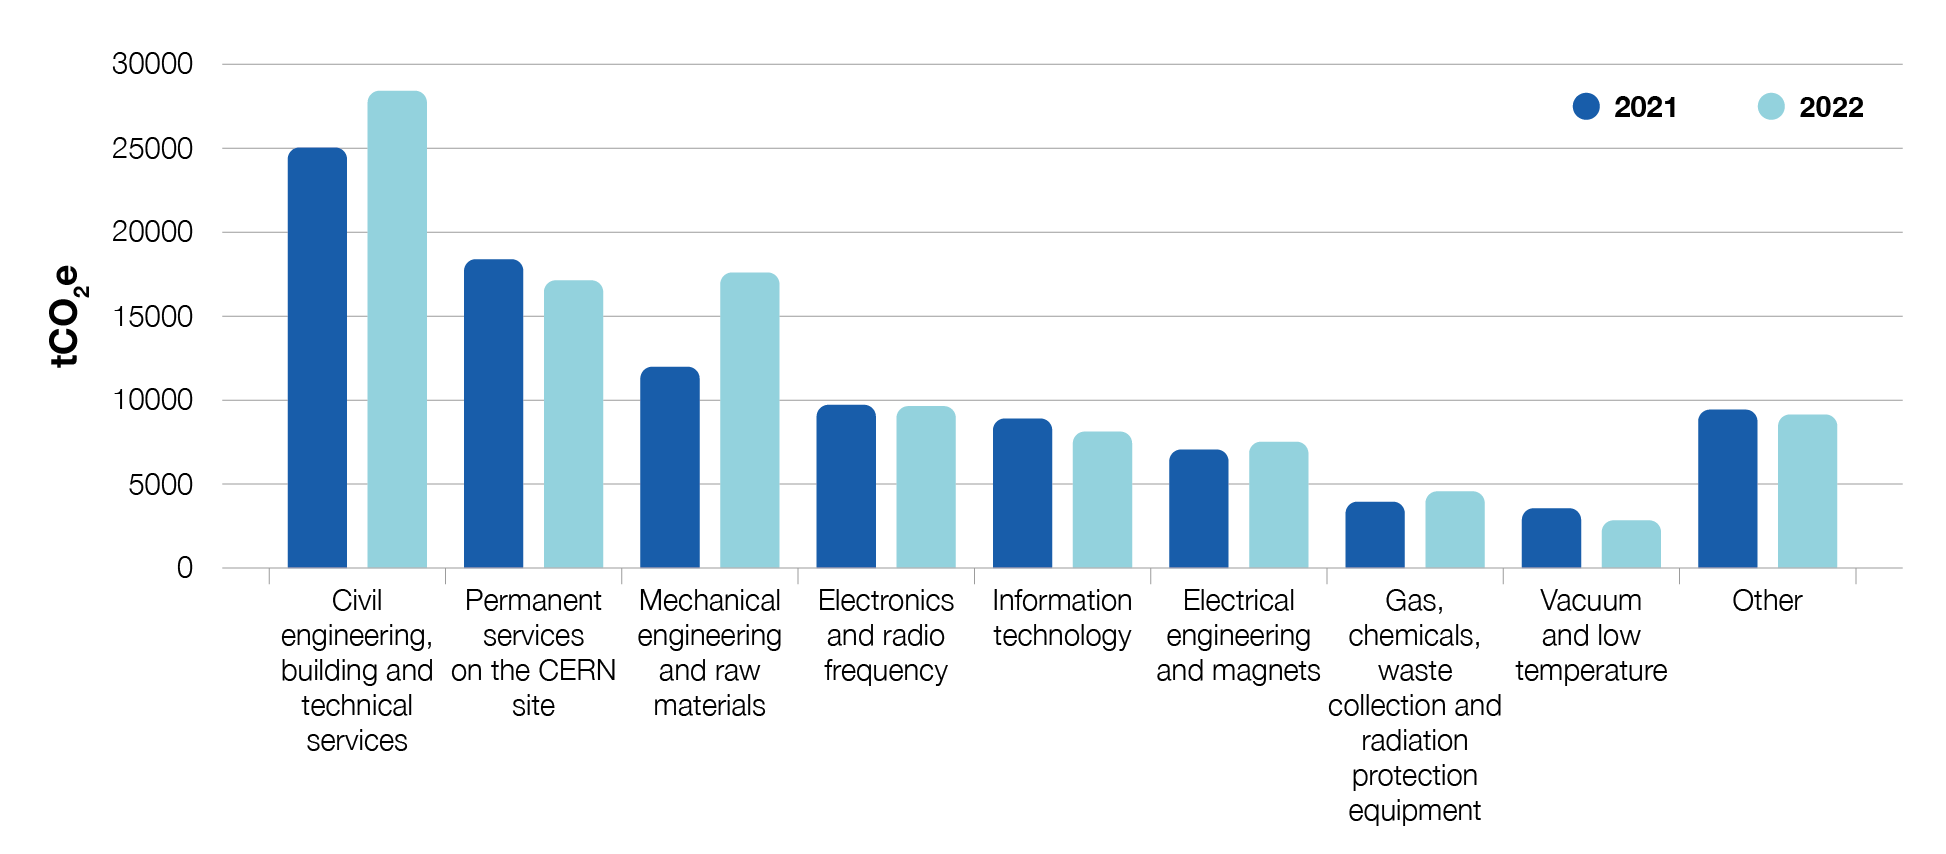
These emissions were calculated using the Greenhouse Gas Protocol spend-based method and emission intensity factors taken from the 2021 EXIOBASE 3 database, using the Climatiq Procurement Endpoint model based on basic prices and including adjustment for inflation. This database is an Environmentally Extended Multi-Regional Input-Output (EE MRIO) table and contains data that describes the complex network of global economic relationships between industries and their environmental consequences. While these calculations have limitations and varying levels of uncertainly, CERN used this calculation method to understand the relative quantity of emissions that result from procurement in comparison with other direct and indirect emissions. Procurement emissions represent about 92% of the total CERN scope 3 emissions, and around 32% of all CERN emissions.
This method helps CERN to identify procurement families for which the reduction and optimisation of CO2 emissions is possible and thus to better prioritise its decarbonisation efforts. In 2021–22, 267 suppliers accounted for 80% of CERN's procurement emissions. Construction and machinery suppliers were responsible for the highest portion of these emissions.
CERN appreciates the limitations of the spend-based methodology and will seek to improve the granularity of procurement emission measurements by working with suppliers to obtain activity-based emissions data. This will allow the Organization to further refine its understanding of the challenges and priorities to be addressed, with due consideration of its complex infrastructure and governance mechanisms.